

An in-depth analysis of competitive European Leagues
The term farmer’s league has been excessively used in recent years to refer to certain European Football competitions. The transfer of your favourite to a league is enough to deem a league worthy or unworthy of viewership. One of the unpleasant consequences of this attitude has been the tendency of voters to overlook league performance metrics for individual awards. This could be seen in the recent Ballon d’Or voting where Robert Lewandowski’s mind-boggling numbers in the Bundesliga were overlooked, favouring LM10’s historic Copa America title. Robert Lewandowski is not alone in his plight of being dismissed by the notional farmer’s league title. Pep has often been called out for his inability to win the champions league, despite his dominance of domestic leagues in which he has coached. Similarly, if you are asked to name the greatest sides in the last ten years, Bayern Munich, Juventus and especially Manchester City would not figure in on the top despite the sheer dominance these teams have displayed in domestic leagues. Their success at the domestic stage has eventually become an albatross on their necks and their undoing.
Although competitive leagues draw their glitz and excitement from competitive imbalance, the nature of incentives and revenues from participation in the champions league or the top tier league in a country (especially the premier league) indicate that a podium finish is not the only prize at hand. A race for the champions league spot, Europa league, a relegation dogfight or even a mid-table finish could be a handsome reward. Hence, although necessary, the usual tendency to focus on league winners is not a sufficient metric to gauge a league’s competitiveness. Entropy measures have been used extensively in economics to study inequality; however, the metrics used to calculate inequality have also been used to examine competitiveness in sports ( Boorah and Magnan 2012). In this article, I try to compare the competitiveness of Europe’s big four leagues using Theil’s Generalised entropy measure (Theil’s Index). The findings would shed light on the relative competitiveness of the leagues over the last decade. The data of point distribution in a league season was taken from www.footballdatabase.com. In economic parlance, a higher value of entropy measure pertains to a higher level of inequality. An increase in inequality can be interpreted as a lower level of competitiveness. Although the metric is not ideal, it would serve as a good starting point for an empirical examination of a league’s competitiveness. A perfectly competitive league would be the one where all the participants are equally matched, and hence all teams would have the same number of points with all the matches being draws.
In figure 1, I have plotted the entropy values for the major European leagues for the last decade. The findings are a bit surprising as it indicates that the Bundesliga gets quite bad rep for being the so-called farmer’s league despite the league having the lowest entropy value in three seasons of the last decade. Further, the Bundesliga was never the worst-performing league in any season in the last decade., Serie A, on the other, has witnessed several seasons with extremely skewed points distribution. Both Bayern and Juventus have dominated their respective leagues in the last decade, but the latter seems to be operating in a less competitive league from our findings.
Fig 1: Competitiveness comparison
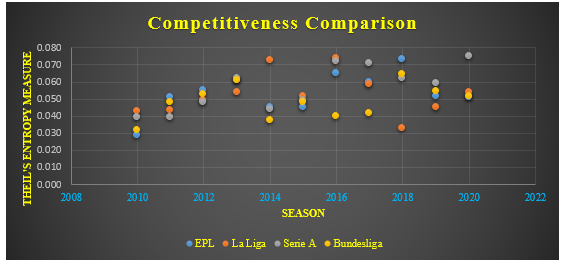
Interestingly, La Liga was incredibly hard to win but also had a highly skewed distribution of points consummate with a high level of entropy. In common parlance, La Liga is a league with an exciting title race, but the teams outside the big three, Real Madrid, Barcelona and Atletico Madrid, are not very competitive in the league despite their excellence in European competitions. But, post 2016, there has been a marked increase in the competitiveness of La Liga, evidenced by their declining Theil’s Index values. Perhaps the most interesting observation is that the English Premier League’s exalted status as the most competitive league might not be warranted. The EPL and the Bundesliga have been the most competitive league three times.
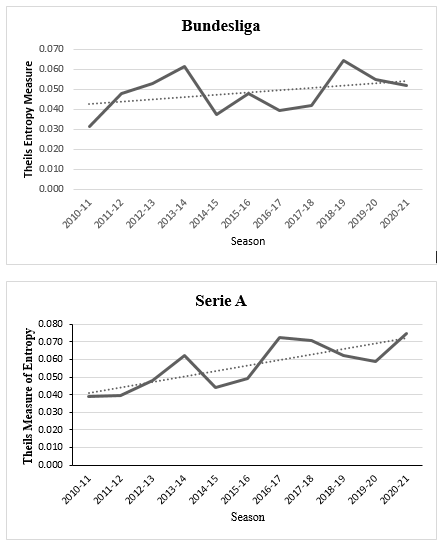
Further, the competitive imbalance in EPL has been increasing over time, as depicted in Figure 2. Similarly, Serie A and Bundesliga have witnessed an increasing trend in competitive imbalance. Still, the former has a higher median value than the EPL, while the latter has a smaller median value (Fig 2). Lastly, La Liga has witnessed haphazard spikes and falls in entropy values sandwiched between a steady rise in the early years and a steep decline in recent years (Fig 2). This hints that the slow decline of La Liga giants has made the league more competitive across the spectrum in recent years.
Fig 2: Temporal changes in competitiveness
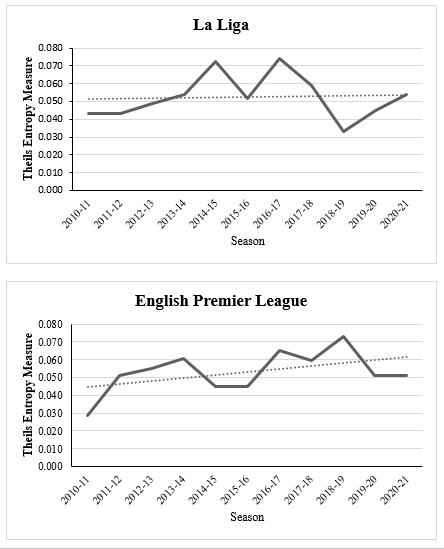
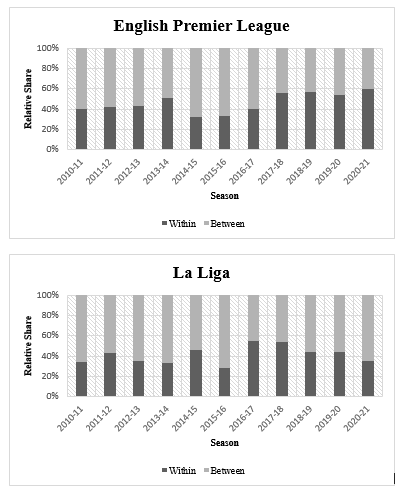
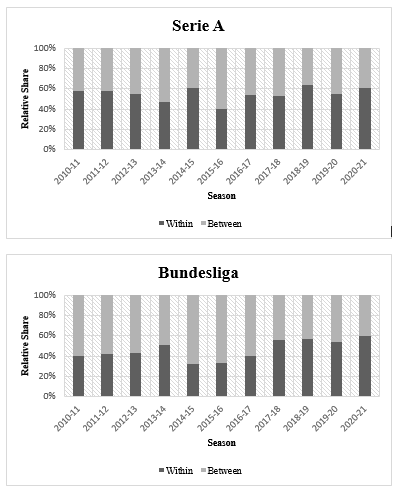
One of the principal advantages of Theil’s Index is that inequality can be decomposed into within and between sub-group components. To put it simply, the share of inequality arising from within a sub-group and between subgroups can be calculated. As the strongest teams in a league compete in the UEFA Champions League, I have included them as part of group A. The rest as part of group B. In the EPL, inequality between groups account for a bulk of the total inequality in seven of the ten years. Still, in the last three years, group inequality has been predominant. La Liga also displays a similar trend of group components being the predominant source of inequality. But in Serie A, the within-group imbalance has predominated the between-group component in all seasons except 2013-14 and 2015-16. In the Bundesliga, the between-group component has been the predominant source of imbalance in 6 seasons, but the last four seasons have witnessed a reversal in trend with the within-group component increasing.
Figure 3: Decomposition Analysis
Our analysis has a few limitations. Firstly, we do not look at the individual teams occupying various positions. A relatively stable top four, for instance, would be indicative of a high degree of competitive imbalance between the groups. This also leads to us ignoring the winner each year. Repetitive victories are a sign of dominance that ought to be incorporated in more rigorous analysis. Secondly, the degree of dominance at the level of each position can be examined using other tools as examined by Boorah and Magnan 2012, which could be more insightful. Nevertheless, the article could serve as the first of many steps to analysing league competitiveness.
Interestingly, when examining the Bundesliga, an increase in the share of within-group inequality has dovetailed with three of Lewandowski’s best goal-scoring seasons. I leave it to the readers to discretion whether Lewa’s goal-scoring prowess is the cause or effect of this imbalance.
Discover more from Footy Times
Subscribe to get the latest posts sent to your email.
Real football lover..