

Imagine a world where every pass, shot, and tackle tells a story – welcome to the fascinating realm of football analytics. In this series, we embark on a journey through the numbers that are revolutionizing “the beautiful game.”
Our first installment offers a glimpse into how statistics have become modern football’s silent strategist. We’ll trace the evolution from simple pen-and-paper tracking to sophisticated metrics like Expected Goals (xG), exploring how raw numbers transform into meaningful insights.
You’ve likely noticed these numbers flashing across your screen during match highlights on Fotmob, WhoScored, or SofaScore. These performance ratings and statistics aren’t arbitrary figures; they’re part of a complex system that helps us understand the true story unfolding on the pitch. But how do we bridge the gap between cold, hard data and football’s artistry? That’s precisely what we aim to discover.
Join me as we explore the fundamentals, uncover football analytics’ origins, and decode the metrics reshaping our view of the sport. Consider this your primer for the deeper analytical adventures awaiting in upcoming articles.
Let’s begin our exploration of how numbers are painting a clearer picture of the beautiful game, one data point at a time.
Origin of football data

In 1950, Charles Reep, an English accountant and Royal Air Force officer, became one of the first to apply statistical analysis to football. He meticulously recorded match events, such as pass sequences and shot attempts, leading to his controversial advocacy for the “long-ball” strategy. Reep’s work laid the groundwork for performance analysis in football.
Different types of football data
In football analytics, two primary types of data are utilised to assess and enhance performance: event data and tracking data.
Event Data:
Event data captures discrete actions during a match, such as passes, shots, tackles, and dribbles. Each event is recorded with specific details, including the time it occurred, its location on the pitch, and the players involved. Traditionally, this data has been collected manually, with analysts annotating each event as it happens. While event data provides valuable insights into the outcomes of specific actions, it primarily focuses on moments when the ball is in play, offering limited information about off-the-ball movements and overall team dynamics.
Tracking Data:
Tracking data offers a comprehensive view of player and ball movements throughout the entire match. Utilising technologies such as optical tracking systems and GPS, this data records the precise coordinates of each player and the ball at multiple points per second. This continuous data stream allows analysts to assess various aspects, including player positioning, speed, acceleration, and spatial relationships on the field. Unlike event data, tracking data encompasses both on-the-ball and off-the-ball activities, providing a holistic perspective of the game’s dynamics.
Combining Event and Tracking Data:
Integrating events and tracking data yields a more nuanced analysis of football matches. Event data provides context for specific actions, while tracking data offers the surrounding spatial and temporal information. For instance, analysing a pass using both data types allows teams to evaluate not only the success of the pass but also the movement of players off the ball, defensive positioning, and potential passing lanes. This combined approach enhances performance analysis, tactical planning, and player evaluation by delivering a comprehensive understanding of both individual actions and team strategies.
Different types of metrics with event data
In football analytics, event data refers to the detailed recording of individual actions during a match. These metrics provide insights into player performance, team strategies, and overall game dynamics. Key event data metrics include: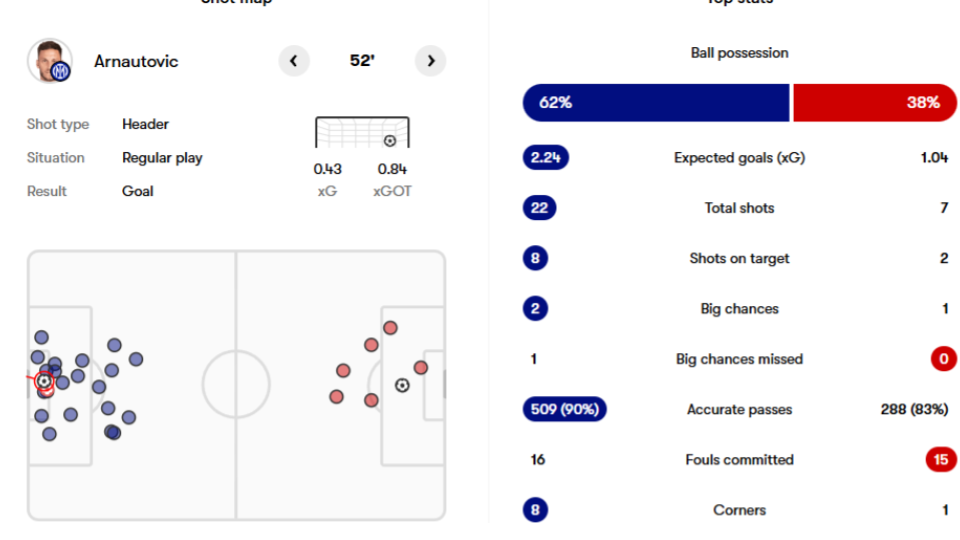
Post-match analysis report with event data from Fotmob and their metrics
- Expected Goals (xG): This metric estimates the likelihood of a shot resulting in a goal based on factors such as shot location, angle, and type of assist. For example, a shot taken from a central position inside the penalty area might have an xG value of 0.4, indicating a 40% chance of scoring.
- shot on target(SOT): A shot on target is any attempt at goal that:
Would have gone into the net if not for a goalkeeper’s save or a defender’s block.
Includes goals since they are technically shots on target. - Pass Completion Rate: This measures the percentage of successful passes a player or team completes. For instance, a midfielder who attempts 50 passes and successfully completes 45 would have a pass completion rate of 90%.
- Tackles and Interceptions: These metrics track defensive actions in which a player successfully challenges an opponent to gain possession (tackles) or cuts off an opponent’s pass (interceptions). For example, a defender with five tackles and three interceptions in a match demonstrates strong defensive contributions.
- Dribbles Completed: This counts the number of times a player successfully dribbles past an opponent, indicating their ability to maintain possession and advance play under pressure.
- Aerial Duels Won: This metric records the number of aerial challenges a player wins, reflecting their effectiveness in contests for high balls.
- Goal-Creating Actions: These are the two offensive actions directly leading to a goal, such as passes, dribbles, or drawing fouls.
- xGOT (Expected Goals on Target) is an advanced metric that refines Expected Goals (xG) by considering shot placement and the goalkeeper’s positioning. While xG evaluates the quality of a shot at the moment it is taken, xGOT measures how much danger a shot actually poses after it is struck and placed on the target.
- progressive pass: A progressive pass is a forward pass that significantly moves the ball closer to the opponent’s goal compared to its starting position. It helps measure a player’s ability to advance the ball and break defensive lines.
- progressive carry: A progressive carry is when a player dribbles (carries) the ball forward significantly toward the opponent’s goal, helping advance play. Unlike simple dribbles, progressive carries emphasize moving the ball into more dangerous areas.
- Expected Threat (xT): Expected Threat (xT) is an advanced metric that measures how much a player’s action increases the chance of scoring. Unlike xG, which evaluates shots, xT considers passes, carries, and general movements that lead to dangerous situations.
By analysing these event data metrics, teams can gain a comprehensive understanding of player performances and tactical effectiveness, leading to more informed decision-making both during and after matches.
In the next article, I will explore xG (Expected Goals) and xGOT (Expected Goals on Target), examining their effectiveness and how fans and media sometimes misuse these metrics.
Discover more from Footy Times
Subscribe to get the latest posts sent to your email.